
November 2023 Monthly – Real Estate Apocalypse, Reverse Repo, US Data Review
November 2023 Monthly – Real Estate Apocalypse, Reverse Repo, US Data Review


Email: decodingpolitics@protonmail.com
Substack: decodingpolitics.substack.com
Medium: medium.com/@decodingpolitics
Twitter: twitter.com/DecodingPoliti2
*Not financial advice, merely pointing out political trends*
Financial markets, after a weak summer, had a very strong rally in November. The S&P 500 was up over 8%. This was attributed to positioning being bearish and to a liquidity injection as the Fed unwound its RRP facility.
Bonds stabilized on lower inflation and on lower use of reverse repo pumping liquidity into the system. We think that the ten year yield could decline further on a position unwind. But we don’t think fundamental investors should own fixed income apart from very boring munis or bills. Treasuries still could sell off on a curve steepening, and credit risks continue to abound in many corners of fixed income.
Real Estate is a disaster, as we discuss below, and will keep the pressure on bank balance sheets for the foreseeable future. Absent a dramatic fall in rates or bank balance sheet expansion, both of which we consider very unlikely, we don’t know how this real estate gets resolved. The market will need lower prices and defaults to make the math all work again.
Gold broke out over $2000/oz. Our BRICS of Gold piece from the summer went through the details of the coming Chinese reserves led breakout in gold- it looks like we are finally there. Clearing $2100 would easily open the door to $3000, with 13 years of overhead resistance out of the way.
Themes are below. We are changing our tune on the Fed, and adding Argentina as what we hope will be a long running theme. We still think you should avoid fixed income and the banking sector.

1) Gaza and Ukraine Updates
2) Fed On Hold For a While, But Still Contracting Balance Sheet…..
3) …..Creating a Potential Mess in 2024 Banking
4) Data Review
5) The Real Estate Apocalypse Rolls On- Latest Anecdotes
1) Gaza and Ukraine War Update
After almost six weeks of conflict, and a few day truce, the war is back on in Gaza. Casualties in Gaza have crossed 15,000 – at least 10,000 civilians and 5,000 Hamas fighters it is claimed, and over 1,000 Israeli casualties.
This has been a nasty war thus far, and it will continue. Israel does not want a two state solution and wants revenge. Hamas is dug in and refuses to even negotiate for a two state (three state in their case?) solution.
As of now, it’s not a market mover. If it stays in Gaza, it won’t be. If it continues to spiral into Lebanon, Iraq, and Syria, then eventually people will care. But there is unfortunately no way this brutal conflict will pause for the next several months- there is way too much ill will on both sides and repeated failures of peace overtures and truces.
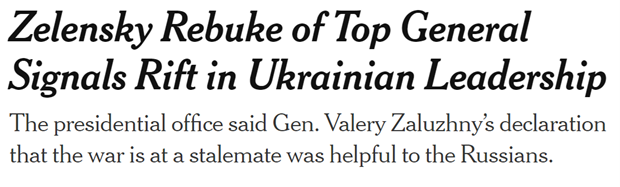
As for Ukraine, it has been out of the front pages while war wages in Gaza. But the headlines show that Ukraine is falling apart and losing vital foreign support.

Zelensky wants to continue to fight. But that has caused havoc within his government, and now he and his defense minister are at odds. They apparently have not spoken for several weeks and Zelensky is sacking his deputies. Sy Hersh is reporting that the two top generals are hashing out a peace deal and may do an end run around Zelensky presenting it to the Russians.
As Zelensky gets more isolated, and the money stops flowing, we are increasingly thinking we will see one of three nasty options for Ukraine next year:
1) The West cuts off aid to force a peace deal
2) There is a Zaluzhny (or some other general) led coup to replace Zelensky
3) Because of poor military performance, no money, and in-fighting, the Ukrainian government and army simply collapse
Things are now falling apart slowly in Ukraine. The army continues to get beat, aid cut or canceled, and infighting is increasing. The Army has always said without foreign assistance it can only fight for 3 or 4 weeks. But look for all these trends to accelerate next year as fatigue sets in. Eventually Russia will sniff out Ukraine’s weakening position and turn up the heat.
Putting these two together, with substantial Chinese support for both and several regional powers, it should now be clear that the American’s worst security nightmare has come true. The dean of American foreign policy, Zbignew Brezinski, wrote the following in his book The Grand Chessboard (1997), on controlling Eurasia:
“Potentially, the most dangerous scenario would be a grand coalition of China, Russia, and perhaps Iran, an ‘anti-hegemonic’ coalition united not by ideology but by complementary grievances. It would be reminiscent in scale and scope of the challenge once posed by the Sino-Soviet bloc, though this time China would likely be the leader and Russia the follower. Averting this contingency, however remote it may be, will require a display of U.S. geostrategic skill on the western, eastern and southern perimeters of Eurasia simultaneously” (p.54).
2) Fed on Hold, But Still Contracting Balance Sheet. We have been saying that the Fed is more hawkish than the market thinks for over a year. But recently, we see the signs of a long pause in rate hikes emerging. But we also think that the market is vastly overestimating the scale of cuts in 2024, again. We see a long pause and maybe an adjustment next year, but no major cutting cycle yet. And, two other Fed tools will continue to tighten financial conditions and may lead to a real hiccup in interest rates and banks next year. Allow us to review recent Fed actions and language, and the data to support our claim.
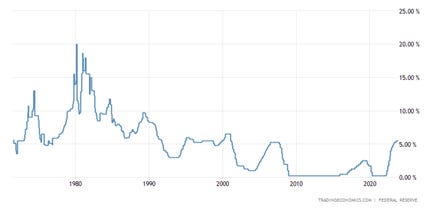
First of all, the Fed Funds rate has risen from essentially 0% to 5.5% in a year and a half. This brings rates up to the normal levels that prevailed pre dot-com bust, pre-GFC, and throughout the late 80’s and 90’s. We should see the 2010’s ZIRP environment as the aberration- not the recent hiking cycle. As this long term chart shows, 5% ish seems to be the mean reverting level. Rates were too high in the 1980s, too low in the 2003-5, and 2010-2020 periods.
The Fed’s last hike was in July, and it looks they will be on hold for at least the December and January 2024 meetings. That’s a six month pause. Thanks to Chatham Financial, we can see what the market expects for rates in the next year (blue line) versus Fed dot plots. The market expects far faster cuts than Fed officials, to below 4% in early 2025. The market has roughly 80% odds of the first cut in March.

We think that the market is probably ahead of itself. First, we want to highlight Fed Powell’s language from December 1st at Spelman College:
Inflation has declined to 3 percent over the 12 months ending in October, but after factoring out energy and food prices, which tend to be volatile, what we call "core" inflation is still 3.5 percent, well above our 2 percent objective…..
….The FOMC is strongly committed to bringing inflation down to 2 percent over time, and to keeping policy restrictive until we are confident that inflation is on a path to that objective. It would be premature to conclude with confidence that we have achieved a sufficiently restrictive stance, or to speculate on when policy might ease. We are prepared to tighten policy further if it becomes appropriate to do so.
That is about as neutral near-term language as you can get. But he also acknowledged, that even in a declining inflation rate environment, it will take time to reach their target of 2.0%, let alone on a sustainable basis. This implies steady for longer to us. The Fed in 2024 will have missed their inflation target (core PCE at 2%) for four years – they need to keep policy restrictive to restore credibility. Absent a financial crisis, we think the Fed will start cutting rates with six months of core PCE with a 2 in front of it. Who knows when that arrives.

core PCE yoy %
On a more short term basis, that is, 1 or 3 or 6 month annualized, the Fed is almost there. But we would have to print the headline numbers at 2% for several months for the Fed to take a victory cut. So we will guess first cuts arrive at the May or June meetings next year. Also, the history of the Powell Fed is to wait until there is a definitive trend change, and then to move aggressively- the 2018 pause, the 2020 COVID cuts, and the 2022 hiking cycle all show that.

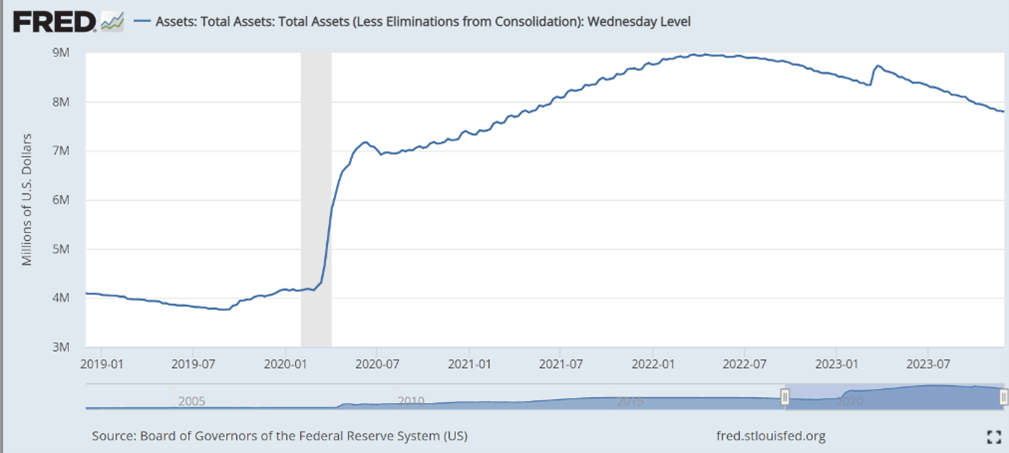
Instead of hikes, we think that they will continue to use certain tools to continue to tighten financial conditions without changing interest rates. First is the continued reduction in the balance sheet, moving along at $80-100bn a month. While they have a long way to go to unwind COVID stimulus, they still have reduced it by $1.2tn since early 2022.
A Fed paper last year estimated that this amount is equivalent to a 25bps hike:
Overall, the model predicts that reducing the size of the balance sheet by about $2.5 trillion over the next few years, as opposed to maintaining the size at its peak level, would be roughly equivalent to raising the policy rate a little more than 50 basis points on a sustained basis. However, this estimate is associated with considerable uncertainty.”
Allowing this unwind to go until the end of 2024 would add another 25bps equivalent of tightening. But this is all going to soon turn into a sideshow compared to the action in the Reverse Repo Facility……
3)……Creating a Banking Mess in 2024. Now, here is where things get a bit more technical, so allow us to walk through the mechanics. In the near term, the unwind in the Fed’s previously massive reverse repo facility will continue to be bullish for risk assets with liquidity being injected into the banking system. Instead of banks putting cash at the Fed for securities, they are buying directly or putting it elsewhere. In the medium term, this trend could turn into a mess.
The Fed has operated a reverse repo facility, which works like you think. Instead of a conventional repo where the Fed gives cash to an entity against a bond, the Fed instead essentially lets money market funds and banks access its security holdings in exchange for the banks putting up cash at the Fed in the form of reserves (more on this later). As the reverse repo facility interest rates rose higher than the Fed Funds and Treasuries, banks and money funds moved heavily into these securities.

But with the end of the Fed hiking cycle, the RRP rate paid is now below the Fed Funds Rate. In addition, the October/November rally in bonds has put market bond yields below Fed funds too. Finally, the Treasury issuance and debt ceiling problems were resolved this summer, leading to a huge amount of fresh Treasury bills hitting the market over the past four months. This has caused the RRP usage to fall from a peak of $2.4tn to now below $800bn. It fell almost $100bn in a single day last week. If it continues at this pace, it would essentially be empty in a few weeks- sometime between late January and March.
RRP usage has done a good job of calling moves in the stock market the past three years. The rally slowed down in late 2021, and then turned into a bear in 2022 as usage rose. RRP usage peaked in September/October 2022, as stocks bottomed. This injection of $1.5tn back into the system away from the Fed has largely been responsible for the face-ripping rally this year. The large move lower should continue to drive gold and stocks for several more weeks. But the music could stop playing in Q1.
On the other side of the Fed balance sheet is the reserves of banks. This comprises cash in circulation, the Treasury’s cash at the Fed, banks’ cash holdings at the Fed, and funds on the other side of the reverse repo facility. As the reverse repo has fallen, reserves have fallen – and this data is only through October, and does not include the recent fall related to RRP, which takes it to probably around $2.6-2.8tn now.

“Okay Decoding you’ve rambled enough- get to the point. Banks used RRP for a year or two, now they shifted back back to T-bills. Who cares?”
This is where our reading of Fed papers comes in handy. We caught a recent one, Fed Balance Sheet Normalization and the Minimum Level of Ample Reserves, that spent a long time analyzing two factors, what is the ‘minimum’ level of reserves in the system, and when will we hit it with the balance sheet unwind?
We note that the paper estimates that this level of reserves could be approximately $2.2-2.3tn (red line)– which we expect will get hit when the RRP empties out in Q1. This is 18 months ahead of the estimated timeline from when this paper was published in February 2023.

Now why does this matter? Well banks use excess reserves to allocate to new credit, and to buy securities. Excess reserves are dry powder- sitting at zero excess reserves means the system has none and will have to delever. The last time this happened was during the repo crisis in 2019, which created interbank chaos and forced the Fed to step in to the tune of hundred of billions. The COVID crisis and inverted yield curve four months later finished the crash foretold by the bond problems in October/November 2019.
Coupling a low level of reserves with a building number of CRE loans to roll over will obviously completely close the spigot for this asset class next year. Please see the anecdotes in the next section on how bad things are now- imagine how much worse they could get!
4) Data Review. Now with the Fed discussion done, where do we stand in the data review of the US economy? Data is hovering around recessionary levels. The data shows a continued slow shrinkage in the banking sector. This may have in past cycles suggested imminent Fed cuts, but as we mentioned above, we think that inflation remains far too high for the Fed to begin moving soon.
The US ISM Manufacturing data is showing a contraction below 50, at 46.7. New orders and inventories were weak too. Continued poor readings would be a solid recession indicator similar to 2007/8.

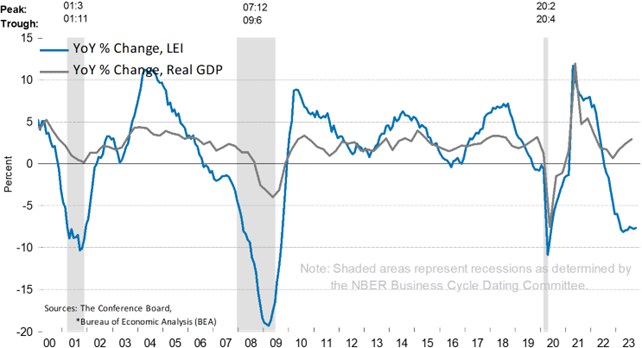
The Leading Economic Indicator has now matched the ’01 and ’20 recessions, and continues to show weakness. 0 levels signal slowdown, -4% signals recession. This is a definitive 2024 recession indicator.

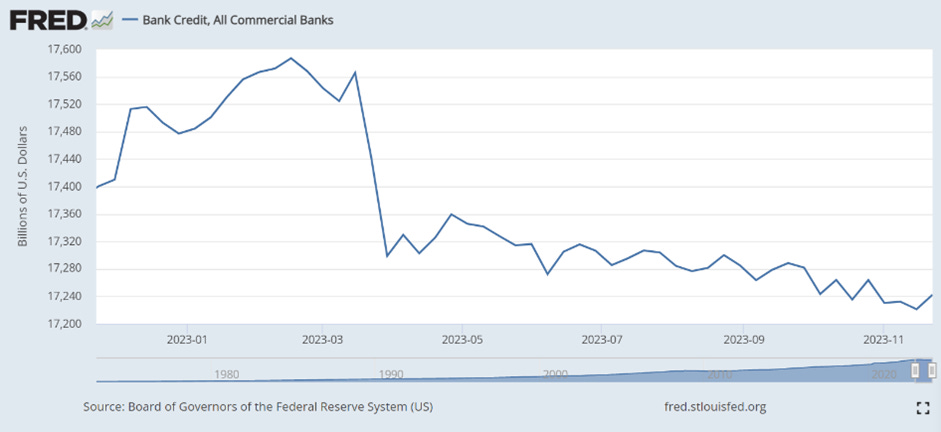
From the real economy on to the banking data. Bank credit continues to slowly decline, a huge risk in an economy with 5% nominal GDP growth.
Deposits have remained largely flat as liquidity goes to the money market funds. We consider this neutral.

US M2 Money Supply continues to contract at a scary rate, 4% yoy. This is the worst data since the Depression.

We are still thinking that as the liquidity environment deteriorates when RRP is drained, coupled with the declining fundamentals outlined here, that we will see the next leg down in banking shares.
5) The Real Estate Apocalypse Rolls On. Although it has not made huge headlines yet, which we think is coming in 2024, the wealth destruction in major real estate projects has been extraordinary since 2020. The combination of high supply, higher rates, and declining office utilization is pounding projects in the secondary market. We just went through the banking data, and a reader can see that the idea that bank balance sheets will expand and refinance all this stuff at generous terms is completely unrealistic. The wave of defaults, vacancies, restructurings and refinancings on onerous terms is going to be with us for the next three to five years until the market clears.
First, let’s walk through how much the math has changed on assets that are high quality and performing. Then we will look at just how bad the impairment is in the lower quality projects.
Commerical Observer did a great article comparing terms of the 2013 and 2023 loans on a New York City office building, 11 W. 42nd st. This prime asset is two blocks from Grand Central Station and across the street from Bryant Park. It’s performing and nearly fully leased. 2013 interest rates allowed the building to cash flow significantly and the owners to cash out 15% of the building’s value. But the new terms on interest rates have rendered the building breakeven and required the owners to inject cash. A comparison table of the two packages:

The building’s appraised value barely changed, as did its rent roll. But the near doubling of senior rates, and the addition of an expensive mezzanine loan, caused debt costs to increase an overall 130% in ten years. That renders this building break even. They had to take out an expensive mezz facility to do the deal, and the senior loan they took out only goes five years, versus ten years the last time. This leaves them with a serious refinancing risk, given the almost zero free cash flow in the building after debt cost. If they had to refinance that senior loan at say 9% in the future, they’d be losing money annually.
Either lower interest rates or much lower building prices will be required in the future for commercial real estate to be profitable again, probably around 50% lower from current levels. Given our view on rates as higher for longer, and credit spreads as gradually widening, you can guess which camp we fall into. This is not because we are perma-bears by any means- it’s just that we can do simple math! We love buying assets that are cheap and cash-flowing (like Brazilian equities), and most large real estate projects simply do not have that profile now.
We don’t know how much of that original 2013 loan was left, but let’s assume it was around $250m. The owners could have sold the building for the appraised $555m, paid back that loan, and pocketed we very conservatively say, after all fees, $250m. If they then put it in a money market fund at 5.5%, they would be getting paid $13.75m per year. Instead, they had to put up $18m to make $400k a year, and pray that rents or building prices recover in the next ten years to make real money. As long as the math on the good projects is that stark, the incentive is for CRE owners to either turn in the keys or take out cash and put it somewhere else.
Now let’s look at some busted properties and markets. The numbers are frightening for the kind of losses that banks could endure. First off, vacancy rates in all major cities have climbed to very high levels in 2022, and keep going higher in 2023:
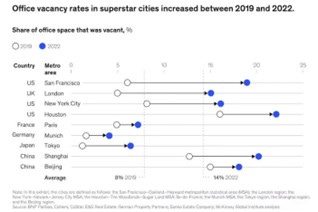
Let’s zoom in on San Francisco, as its deterioration has been stunning. San Francisco’s vacancy rate has reached 35% recently, a number that is totally unsustainable longer term. A rash of recent defaults, foreclosures, and sales have occurred- all at rates that are a fraction of pre-pandemic levels.
· 15 Montgomery Street sold in 2018 for $64m, recently auctioned post default for $15m. The lenders will take a near total loss on the $65m of debt outstanding after paying fees, taxes, contractors, etc.
· 550 California Street sold for $108m in the year 2005, and just sold for $42.6m
· 350 California Street sold recently for $61m, after being listed for $250m in 2020
· The North Park office complex was bought by its former owners for $90m, after they sold it to Blackstone in 2018 for $245m
We could go on. But the math is pretty stunning – it seems the new market clearing values in San Francisco are roughly 60 to 70% lower than in 2018. And that’s with vacancy rates and interest rates continuing to rise. We could be down 80 or 85% by the time the cycle concludes. Selling buildings at those prices would wipe out existing equity holders, obviously. But even ‘conservative’ 50% or 60% LTV loans taken out during the boom will endure massive losses. The aggressive 80% LTV loans that were common in the 2010’s would be almost a full wipeout in many cases after all fees.
Other major cities’ deterioration has not been as stunning, as arguably San Francisco has injured itself by being so mismanaged. But most other urban centers are still facing the same issues of oversupply, work from home trends, and lower rental rates. We will spare inundating our readers with all of the individual anecdotes, but suffice to say that cities from LA to Louisville to Baltimore have seen similar CRE transactions at a third of their 2018 or earlier value.
If we pencil in that the CRE market is worth half nationally of what it was in 2018 and will cash flow far less, then that implies several trillion of equity that needs to be issued and property losses taken. Even the hottest markets like Miami are seeing property prices still slightly under 2018 levels because of dealing with higher interest rates. But banks have vastly more exposure to the problem markets like LA, San Fran, New York City, Washington, etc.

Miami Office Space Selling Prices, per sq ft. (blue)
Florida Office Space Selling Prices, per sq ft. (green)
The catalyst to make everyone finally realize losses is the maturity wall facing the sector – it continues to rise. Extend and pretend will simply fail in the next year as banks have too many problem properties, and balance sheet capacity dries up.(c/o Benefit Street Capital).

And it’s not just CRE, although that leads the way. Stories abound of problems in multi-family. High levels of supply and higher rates are hitting formerly hot markets like Texas. The short term rental markets in several places have been shut down by higher costs, less travel, and higher rates. Scottsdale/Phoenix STR revenue is down almost 50% yoy in 2023:

To any real estate investors out there, we recommend you watch this BlockWorks interview where a landlord with several million square feet of space said it “was worse than anyone thought” and he goes through step by step why. Barry Sternlicht, a billionaire real estate investor, has said there is a Cat 5 hurricane over real estate now.
Given that banks have several trillion in loans on this stuff, you can imagine why we remain bearish on banks. As an example, PNC Bank’s deterioration in real estate assets has been quick and dramatic. Although they claim that the office portfolio is less than 3% of total, it has generated $750m in NPLs and rising. They also have a large multi-family portfolio.

But there is a bright side to all this! If you are defensive and build cash through this cycle, in two or three years you should be able to cherry pick assets from banks that are stuffed to the gills. They will be begging investors to take all this stuff off their hands, at any price. Exactly like in the early 1990’s Resolution Trust Committee era. Fortunes were made then, and will be made this time too.